


On Solving for Unemployment in India
Understanding aspirations and how technology can achieve them


Inspiration ⚡️
In June 2022, during a trip to Udaipur, a friend and I got on a call where we passionately expressed our inclination towards starting our own venture. Coincidentally, this was around the time I was thinking about the multidimensional measurement of poverty while reading Dr. Anirudh Krishna’s book — One Illness Away. In it, I came across a particular story that outlines how “the fear of the unknown limits what individuals aspire to achieve”.
Briefly, the story spoke of Chandru — a boy based in a village of rural Andhra Pradesh. At 15 years old, Chandru was an excellent mathematician and aspired to be an engineer someday, not letting the crippled right leg due to polio demotivate him. However, the financial burden alongside the lack of information and support towards becoming an engineer made it difficult for his father to help achieve this dream. Interestingly, despite the availability of a fully-funded government scholarship that Chandru could apply for, his father remained stoic.
“It is not for the likes of us. No one from here can become an engineer. No one ever has.”
Reading this made me think of how the aspirational horizons of people depends greatly on the socio-economic class they belong to. Anthropologist Arjun Appadurai astutely notes:
“Better off individuals tend to have a more complex experience of the relationship between a wide range of ends and means, because they have a bigger stock of available experiences. Poorer members have a more brittle horizon of aspiration and a thinner, weaker sense of pathways.”
The call with my friend ended with us deciding to build a platform that would help broaden these horizons and create a sustainable difference. Our thesis was simple:
Problem Statement 1: People living in India’s Tier 2 and Tier 3 cities and towns have limited professional horizons, much like Chandru’s father did for his son in the above story. These horizons stunt what individuals can achieve — financial stability, home ownership, higher qualities of healthcare and education to name a few.
Problem Statement 2: Startups in India’s Tier 1 cities struggle to hire talented individuals at the right price. As such, meaningful work is not achieved, and impactful products are not built, and hence a lot of potential remains untapped.
Solution: A hiring platform that connects bright, talented, and aspirational individuals in Tier 2 and Tier 3 India to startups in Tier 1 India.
As the non-technical founder of this project, my role was studying the market for HR technology companies as they were the closest analogue to what we were aspiring to build. In this endeavour, I analysed multiple businesses, sized the market, hired an intern, and conducted user research with prospective job seekers. Some of the methods I followed were along the lines of what I had learnt during my time at an EdTech venture started by India’s largest educational conglomerate. What I found during my research was very interesting, and in this week’s newsletter, I would like to share some of that with you. Happy reading!
A Primer on Market Sizing 🤓👆🏻
Before I outline my study on HR technology businesses, let me introduce the concept of market sizing. In business, market sizing is a simple yet fundamental exercise that business owners, managers, and analysts undertake to understand the potential of any market. The word “potential” here differs based on the exact goals of the exercise, but more often than not refers to revenue, customers, or units sold. Essentially, anybody who is sizing a market is trying to understand the maximum revenue a business can achieve, the maximum audience that the business can reach, and/or the maximum number of units the business can sell in a specific market.
Here is some terminology to help understand this better:

TAM: Total Addressable Market (TAM) is the total market demand for a product or service. It is the maximum amount of revenue a business can generate by selling its product or providing its service in a market. TAM is a businesses’ best bet to objectively estimate the growth of a certain market. This metric also helps founders understand product-market fit.
SAM: Serviceable Addressable Market (SAM) is the portion of the TAM that companies can realistically capture given their geographical limitations. This metric helps define set targets in the market that can be captured.
SOM: Serviceable Obtainable Market (SOM) is the portion of the SAM that the company can get at its current scale. Realistically, as a business it is impossible that 100% of the market will buy your product, and therefore the SOM gives businesses a more pragmatic picture of the audience that can be captured. The SOM is best for setting short-term growth targets, understanding the competition, and strategising.
In most market sizing exercises, these metrics are enough to get you started. However, just knowing what these mean is certainly not enough. It is also crucial to understand what each of these components consist of and how to arrive at reasonable estimates.
Let’s take a simple example.
Imagine you want to open your own coffee shop in a city with a population of 1M people.

To understand if this business will take off, let’s calculate the potential revenue it could generate.
TAM: Recall that TAM is the total addressable market or the total revenue opportunity your business has if you reach 100% of your customer base.
This calculation requires us to have three pieces of information in place1
Population Size
Price per Unit
Number of Units Sold
Therefore, the TAM formula is:
Population x Price of a Coffee Cup x No. of Coffee Cups Sold
Our population figure is already provided — one million people. For this example, let us assume that the price per coffee cup is $3 and people drink 100 coffee cups per year.
Therefore, our TAM is:

That’s a $300M opportunity! But can we capture all of it? Let’s look at the SAM and SOM to answer this question.
SAM: SAM is that portion of the market you can realistically capture given your geographical limitations. Assuming this is your first coffee shop, it is likely that you can only serve a small region of your city. Let us say that your coffee shop is setup in the Northern part of the city which has a population of 200K people.
Therefore, our SAM is:

That’s still a sizeable number of people as $60M is no joke! However, you notice that in the Northern region of the city, there’s several other coffee shops too. What does that mean for your business? Let’s take a look at the SOM.
SOM: SOM is the segment of the SAM that you can realistically capture given your size, scale, competition, unique selling point, etc. You do a little analysis of the other shops around you and feel that realistically you could capture 10% of the SAM. This means, that your SOM is $6M.
Therefore, out of the entire revenue potential that this business could generate in your city, you can capture about 2%. Although this number may seem measly, keep in mind that as your business grows, the greater your potential to capture more of the market.
The above example was a very simple illustration on how markets are sized and business potentials are evaluated. As each market is unique, and each product serves a different purpose, arriving at the right number gets a little tricky. Let us look at the market for hiring platforms to understand better as to why this is the case.
India’s Labour Market 👷🏻♀️👷🏼
As the first step of market sizing requires us to find the population size, a few data points on the Indian labour force can be analysed to get a grasp on this figure:
Labour Force Participation Rate: The Labour Force Participation Rate or LFPR is defined as the percentage of people in the labour force i.e. those who are working, seeking, or available for work in the population.
From the Periodic Labour Force Survey data we can see that LFPR has grown year on year, albeit slowly. Some of this slow growth can be attributed towards the COVID-19 crisis, spanning from late 2019 to around early 2021. However, the spike in 2022-23 numbers provides promise for a more workforce active population in the coming years.
Worker Population Ratio: The Worker Population Ratio or WPR is defined as the percentage of people employed in the population.
From the data above, it is clear that a trend similar to the LFPR has reflected itself in the WPR where year on year, there has been improvement, with a jump in 2022-23.
Unemployment Rate: The Unemployment Rate or UR is defined as the percentage of people unemployed amongst the workforce.
Over the years, although the LFPR and WPR have gone up, the UR has gone down, which indicates that less people are without a job.


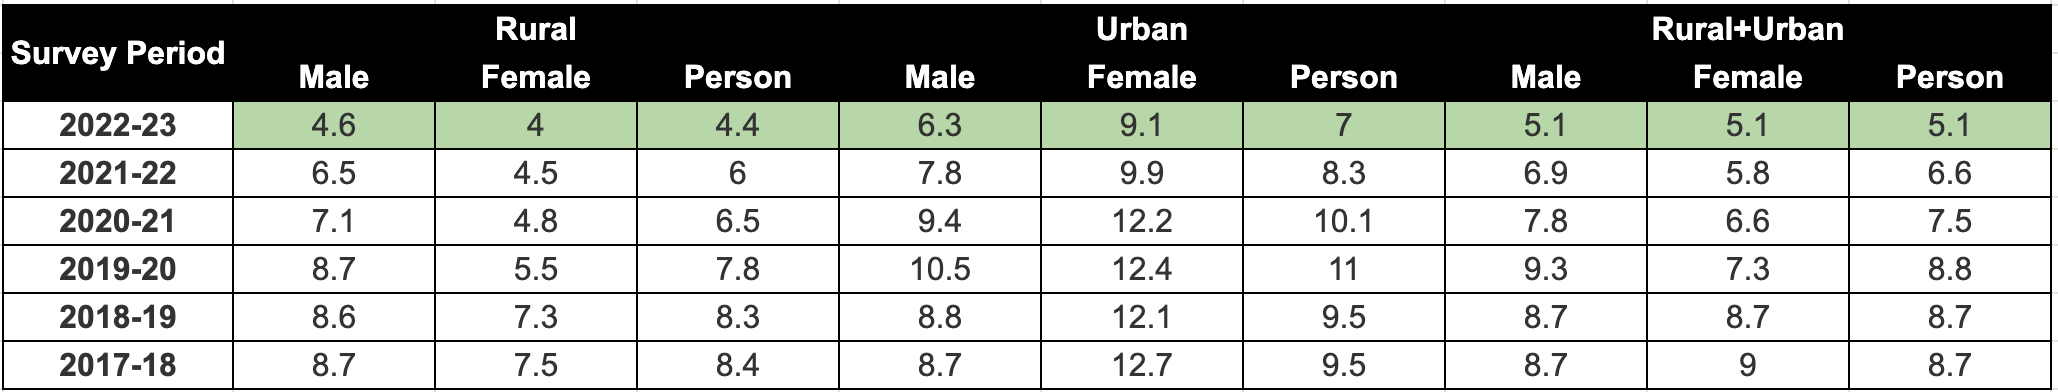
How do we make sense of this? Essentially, the data is telling us that more people are ready to take up jobs or are working currently, while simultaneously, people are finding jobs, thus reducing the unemployment rate. Although this is the case across the years and within the rural and urban populations, for the purposes of our analysis, let’s dig a little deeper and look between the rural and urban landscapes.
A secondary glance at the tables will highlight that the phenomenon outlined above is most pronounced in rural areas, where the average LFPR is 60.8% compared to 50.4% in urban areas, and rural unemployment rate, is 4.4% as compared to urban’s 7%. These numbers could be primarily due to structural unemployment, informal sector dominance, rural-to-urban migration, and a higher rate of urban female unemployment. However, percentages alone do not provide the whole picture. Two simple back-of-the-envelope calculations give us some more clarity:
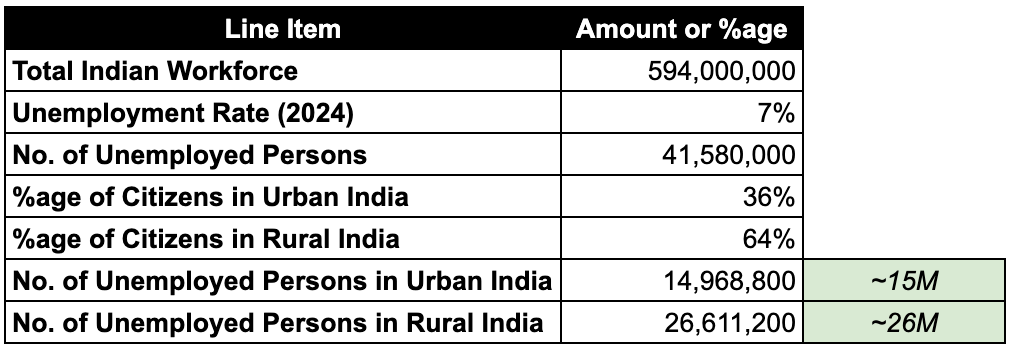
From the above table, it is clear that the total number of unemployed people in India (42M) is split unevenly with a significant portion in the rural areas. Although not surprising, let us validate this with another form of calculation where we first split the workforce, and then apply separate unemployment rates per region to come to the raw figures.
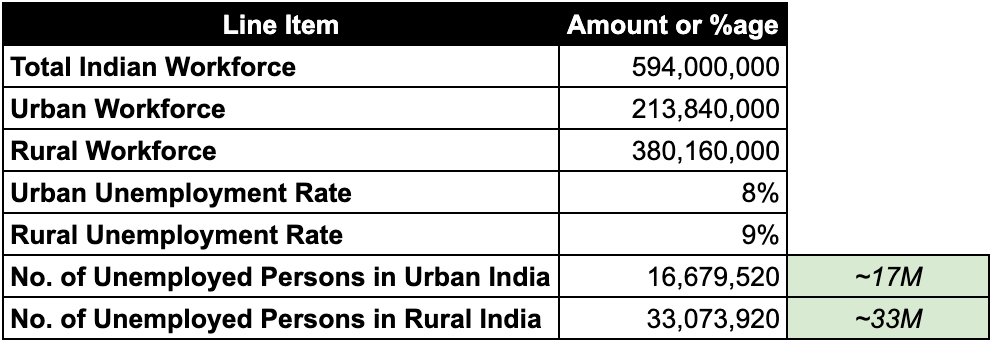
Although both figures are somewhat close, Reuter’s finds similar data to Table 7 where given the 8.1% unemployment rate and ~600M people in the labour force, ~48M people are unemployed. Therefore, the insight we derive from this data is that despite a higher urban unemployment rate, due to the population size, the number of unemployed individuals in rural areas is larger.2
Moving forward with Table 7’s data, a simple calculation then gives us ~550M people employed along with those available for work but not seeking a job. Given that the data from the CEIC shows that as of December 2021, 475M people were employed in India, let us assume that the delta between these two figures is the latter.
However, do all the 525M people in this calculation benefit from the platform that my friend and I envisioned? Not necessarily. Given that the access to internet and digital platforms is a key part of utilising such a product, we segment the population accordingly.

We now know how many people the total market consists of i.e. we know the potential population of the market. As a next step in sizing, it is important that we understand the optimal price that these people would be willing to pay for a hiring platform. Hence, we spoke to 50 job-seekers to understand their thoughts about such platforms particularly around price, features, and pain points.
Putting a Price on Employment 💸
A very reliable yet under-appreciated resource of information is qualitative data. During the course of understanding the labour market, the tech behind hiring platforms, and the competition, I hired an intern to help us get answers to a few pressing questions. In a nutshell, here are some of the key findings from our research with 50 people spread across T1 and T2 India:

Coupling this data point of >45% people using online hiring platforms along with this data on platform usage:

Gave us enough confidence to know that people were using such platforms and that there was ample awareness around them. We now needed to zero down on price, and that’s where the following two data points really helped us gauge the market:

and

From this, we understood that the average price someone would be willing to pay annually for a hiring platform would lie primarily between Rs. 1,000 - Rs. 2,000 (~$15 to $25). We can safely average this out to Rs. 1,500 or ~$20.
Now that we have two of the main ingredients to size this market, namely, our segmented population, and the price, let us calculate the TAM.
Sizing the HR Tech Market 📐

At first, seeing this figure gave me a bit of a scare. Was my math right? Does my research make sense? Did I choose the right figures? All these questions and more cluttered my mind. Thankfully, a few weeks post this, Riverwalk Holdings posted their own analysis of the recruitment market size and found that for the white collar industry alone, there is a ~$4B TAM in India. We can assume that the difference between my calculations and that of the fund lies in blue collar jobs and beyond.
Although we were looking at a large TAM with excitement, it was time for us to ground ourselves. We quickly calculated the SAM for the population of Karnataka3, and hit a reality check.

$250M is not bad at all, but is a sizeable difference from the entire market. As for the SOM, realistically, we believed that at our scale, we could at least capture 1% of this, and therefore set our SOM at $2.5M. Additionally, we also adopted a separate approach to understanding the market by surveying the competition.

By conducting some in-depth research and a few growth calculations from past figures, we found that only ~15% of the TAM was captured by large organised players. In conclusion, by putting three facts together, we had the confidence and knowledge that we could build something impactful:
A large part of the TAM remained untapped, and even 1% of the SAM was enough of an opportunity to start building in this direction.
Nobody else in the competition who was a large organised player was driven solely by the mission that we set out with.
Through our user research we had covered a few questions around how people felt about the hiring platforms that they were using alongside what they expected from a paid hiring platform. This gave us a keen insight into what kind of product we needed to build.
The Consumer Sentiment Behind Hiring Platforms
As we were building our “coming soon” landing page, we looked through some more of the data we could gather from those interviewed to better prioritise features. Here are some of the more questions people were asked, and their insightful responses to them:
What has your job hunting experience been like?
Quote 1: “The platform I used had a bad user interface. The response time of companies was way too long, and the platform even had a limit on job postings.”
Quote 2: “Most of these platforms have job listings that are just schemes to promote the company.”
Quote 3: “The job description and the actual job don’t match on these platforms.”
Quote 4: “The entire application process is complex! A lot of unnecessary questions that are usually asked during the interview stage are asked during the application.”
The quotes above told us that the job hunting experience has been largely negative, with dissatisfaction stemming from ineffective online job portals and poor response rates. Some key challenges included a mismatch between qualifications and available opportunities, demanding application processes, and job descriptions not aligning with actual roles. Additionally, candidates faced low response rates, payment issues, and intense competition, often perceiving company schemes as self-promotional.
Interestingly, many relied more on personal connections than online portals, though some had positive experiences through Instagram and college placements. Despite the generally poor experiences, there were instances of smooth application processes and timely responses. Overall, however, the desire for improved job matching, simpler application processes, and better platform communication was evident, with personal networks proving more effective than online job searches.
What are your expectations from hiring platforms?
Quote 1: “Filters for unpaid and paid opportunities would be helpful. Also, filters for full-time, part-time, and internships would be great.”
Quote 2: “The job description and the work itself should match, if it doesn’t then the application is a waste of my time.”
Quote 3: “The platform should have a verification for companies that are listing jobs.”
Quote 4: “Just get back to me!”
From these quotes it is clear that people expect job hunting platforms to improve by separating paid and unpaid opportunities, providing filters for job types, and ensuring job descriptions match actual work. Other points of significance included the importance of direct employer connections, timely responses, and updates on applications, including feedback on rejections.
Furthermore, there is a strong need for better screening processes to ensure legitimate opportunities and to include large companies, not just startups. On how people perceived the usability of the platform, many want a user-friendly interface, fewer ads, more specific searches based on qualifications, and networking features to connect globally. Finally, people also desire verified job postings, support in presenting themselves to employers, and a focus on diverse fields beyond corporate roles.
If you paid for such a platform, would your expectations change? How?
Quote 1: “I would like it if we could easily converse with employers.”
Quote 2: “Skill courses like LinkedIn Learning would be a great way to learn the skills that we lack even if we don’t get a job.”
Quote 3: “It would be great if we could see the acceptance rate at certain companies. Additionally, updates to a profile should result in more job opportunities related to that update. For example, adding a finance certification should show me more finance jobs. ”
Quote 4: “I’d like some preference being given in terms of visibility, relative to free users. Also, more opportunities should be given to those who are first-time jobseekers. ”
Quote 5: “A guarantee that I would get a job.”
In essence, people are willing to pay for an HR-tech solution if it offers significant advantages over free versions. Key expectations include direct contact with employers, visibility into company acceptance rates, and improved chances of receiving responses from companies.
Moreover, people are willing to pay if they have enhanced profile visibility and priority over free users, along with legitimate job opportunities and skill-building courses. Features such as tailored job recommendations, better filtering options, and insights into employer preferences are highly valued.
Finally, jobseekers also look for quicker response times, feedback on applications, and the ability to connect with current employees for better understanding of roles. A trial period for the paid version and assurances of job legitimacy are crucial for potential subscribers.
Out of all the data we collected, these three questions and their subsequent answers gave us immense insight into people’s perceptions and expectations of hiring platforms. At this point, our understanding of the market was relatively better than when we had started, and we were confident that we could build a product that would create vast opportunity and broaden horizons. However, life had other plans!
Conclusions and Caveats
As new opportunities came both mine and my friend’s way, we decided to take a brief hiatus on building this product. Although the both of us believed strongly in the vision, we were at the wrong place, at the wrong time. Despite this, my faith in this idea has not withered. I fervently believe that outside of the business opportunity, such a product, if built the right way by the right people, has the potential to transform lives, and so, I leave you with my research on the Indian job market and the hiring platforms that are scrambling to disrupt it. However, I would like to point out a few caveats before you run with the knowledge I have poured into this newsletter:
Our user research data is from 50 people across Tier 1 and Tier 2 India. A more representative sample would be a population across Tier 2 and Tier 3 India. This adjustment might bring the average price up or down, depending on the region you are in.
LFPR, WPR, and UR figures are latest to 2022-23. Updating these figures to 2024-25 would be helpful to understand the most recent trends. However, I personally do not expect a large sway in the numbers.
Our TAM calculations are solely for the B2C or “supply side”. We have not seen the “demand side” or the B2B side where we calculate for companies that will pay for such a subscription platform to hire candidates. As most market place businesses, there are always buyers and sellers.
Our research on the revenue figures of hiring platforms and HR-tech companies is as recent as 2022-23. Once again, an update would be required to conduct more recent calculations, which I personally feel will mean more of the TAM has been captured, but only an incremental percentage.
If you have reached this far, thank you very much for reading this week’s issue from Consortium. I have loved every bit of research, writing, reading, scrapping, and re-writing. I hope you have enjoyed this as much as I have, and have hopefully learnt something new along the way.
See you soon!
MVP
In this calculation, we take price of a coffee cup and the number of coffee cups sold because revenue is simply the price per unit sold times the total number of units sold.
This split analysis of urban and rural is done to understand the nuances of each labour market as the key demographic for the product lies in semi-urban and rural areas.
As both my friend and I are from Bangalore (the capital of Karnataka), we assumed that given our current ideas for GTM, this would currently be the most realistic geographical limitation we can place on ourselves. Here, the 5% is extrapolated as the ratio of Karnataka’s population to India’s total population.
This was such a lovely read - learned so much that I didn't expect to, especially on market sizing!